![]()
![]()
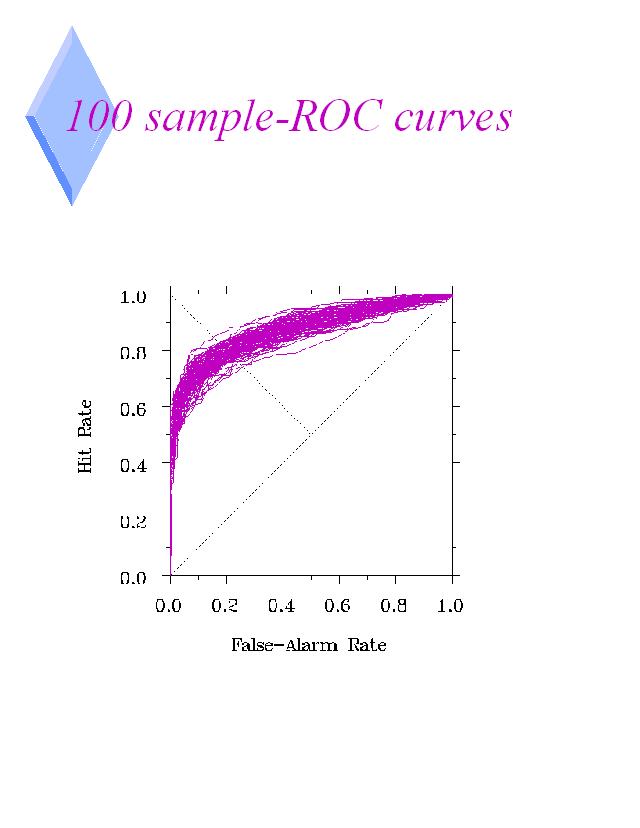
One way of looking at this situation is by considering the ROC curves of the ideal observer - one based on the probability densities of the evidence conditional on the event, the other using samples from these densities. If we look at a number of sample ROC curves of size N we can measure the amount of variability. In this example there are 100 ROC curves based on 200 samples per event. This variability is what I call Common Noise Sampling Variability. It is common noise because in any one experiment, only one set of stimuli is used. Thus there is only one sample ROC curve per experiment.
If the experiment was repeated with a different sample then another sample ROC curve will obtain.