![]()
![]()
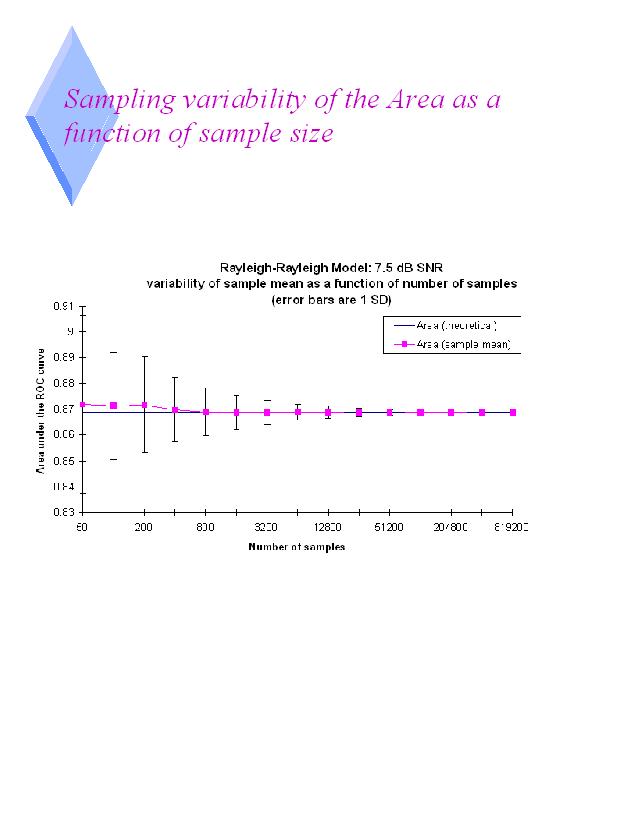
This graph shows the theoretical area, the average area from the sample-theoretic ROC curves, and the standard deviation of the sample theoretic area, all as a function of the number of samples.
This graph is plotted with the abscissa being a logarithmic scale.
The sample ROC area tends towards the true theoretical ROC area, and the standard deviation decreases as a function of samples added.